A place where history meets data&graphics

Unique and comprehensive resources for digital history: data visualizations, maps, infographics, charts, timelines and more.

Create history maps with our map maker tool

Build a map

Check out our latest Data visualizations

Ancient Roman inscriptions

View data visualization
Ancient Roman inscriptions

Ancient Roman amphitheaters capacity

View data visualization
Ancient Roman amphitheaters capacity

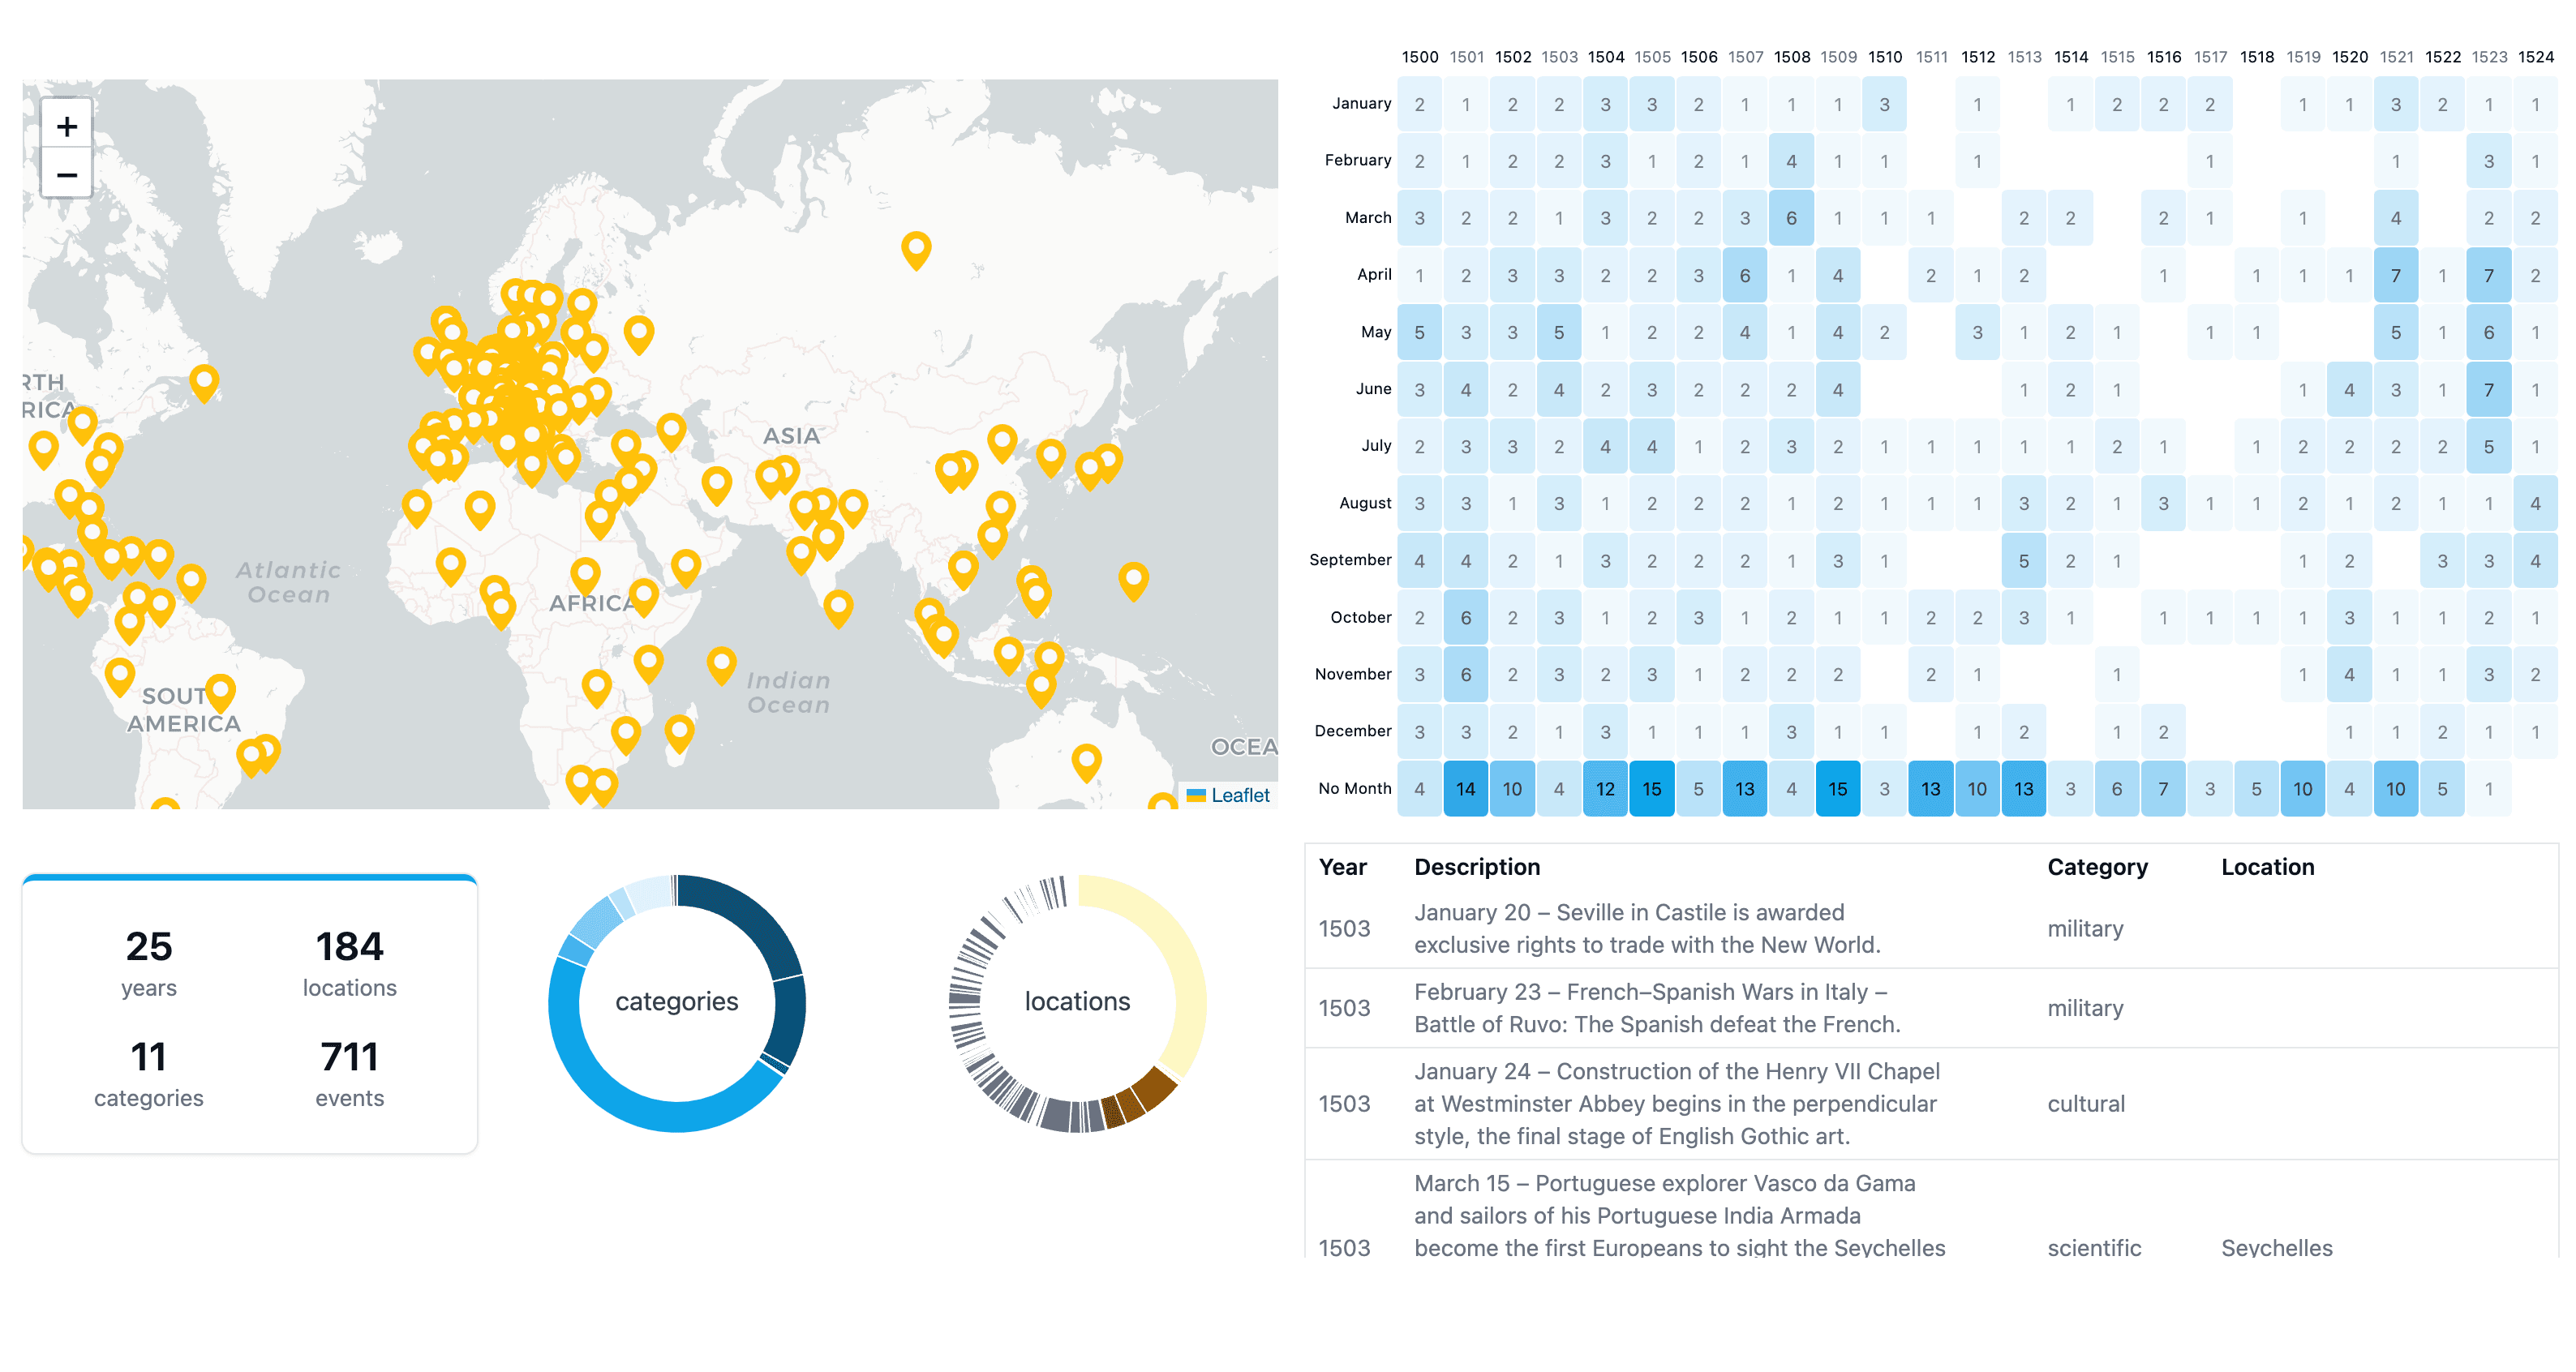
Find your own insights while exploring the data in our world history events dashboard

Go to dashboard
Colosseum
Hieroglyph
History
Vase
AncientScroll
Parthenon
Pillar
Rome
Pyramid
Vikingship

Check out our latest Infographics

Egypt

Capitals of Ancient Egypt

Exploring the historical capitals of Egypt

View Infographic
Capitals of Ancient Egypt
Sumer

Cuneiform writing

Exploring one of the world's oldest writing systems

View Infographic
Cuneiform writing

Thoughts on history, programming, design and data

Introducing world history events dashboard
Web Development

Introducing world history events dashboard

Discover the power of the world history events dashboard, an innovative tool for visualizing and analyzing historical events. This interactive platform provides new insights into our past through detailed maps, timelines, and statistical data.

4 minute read

Subscribe to digital history newsletter

Join and explore digital history world