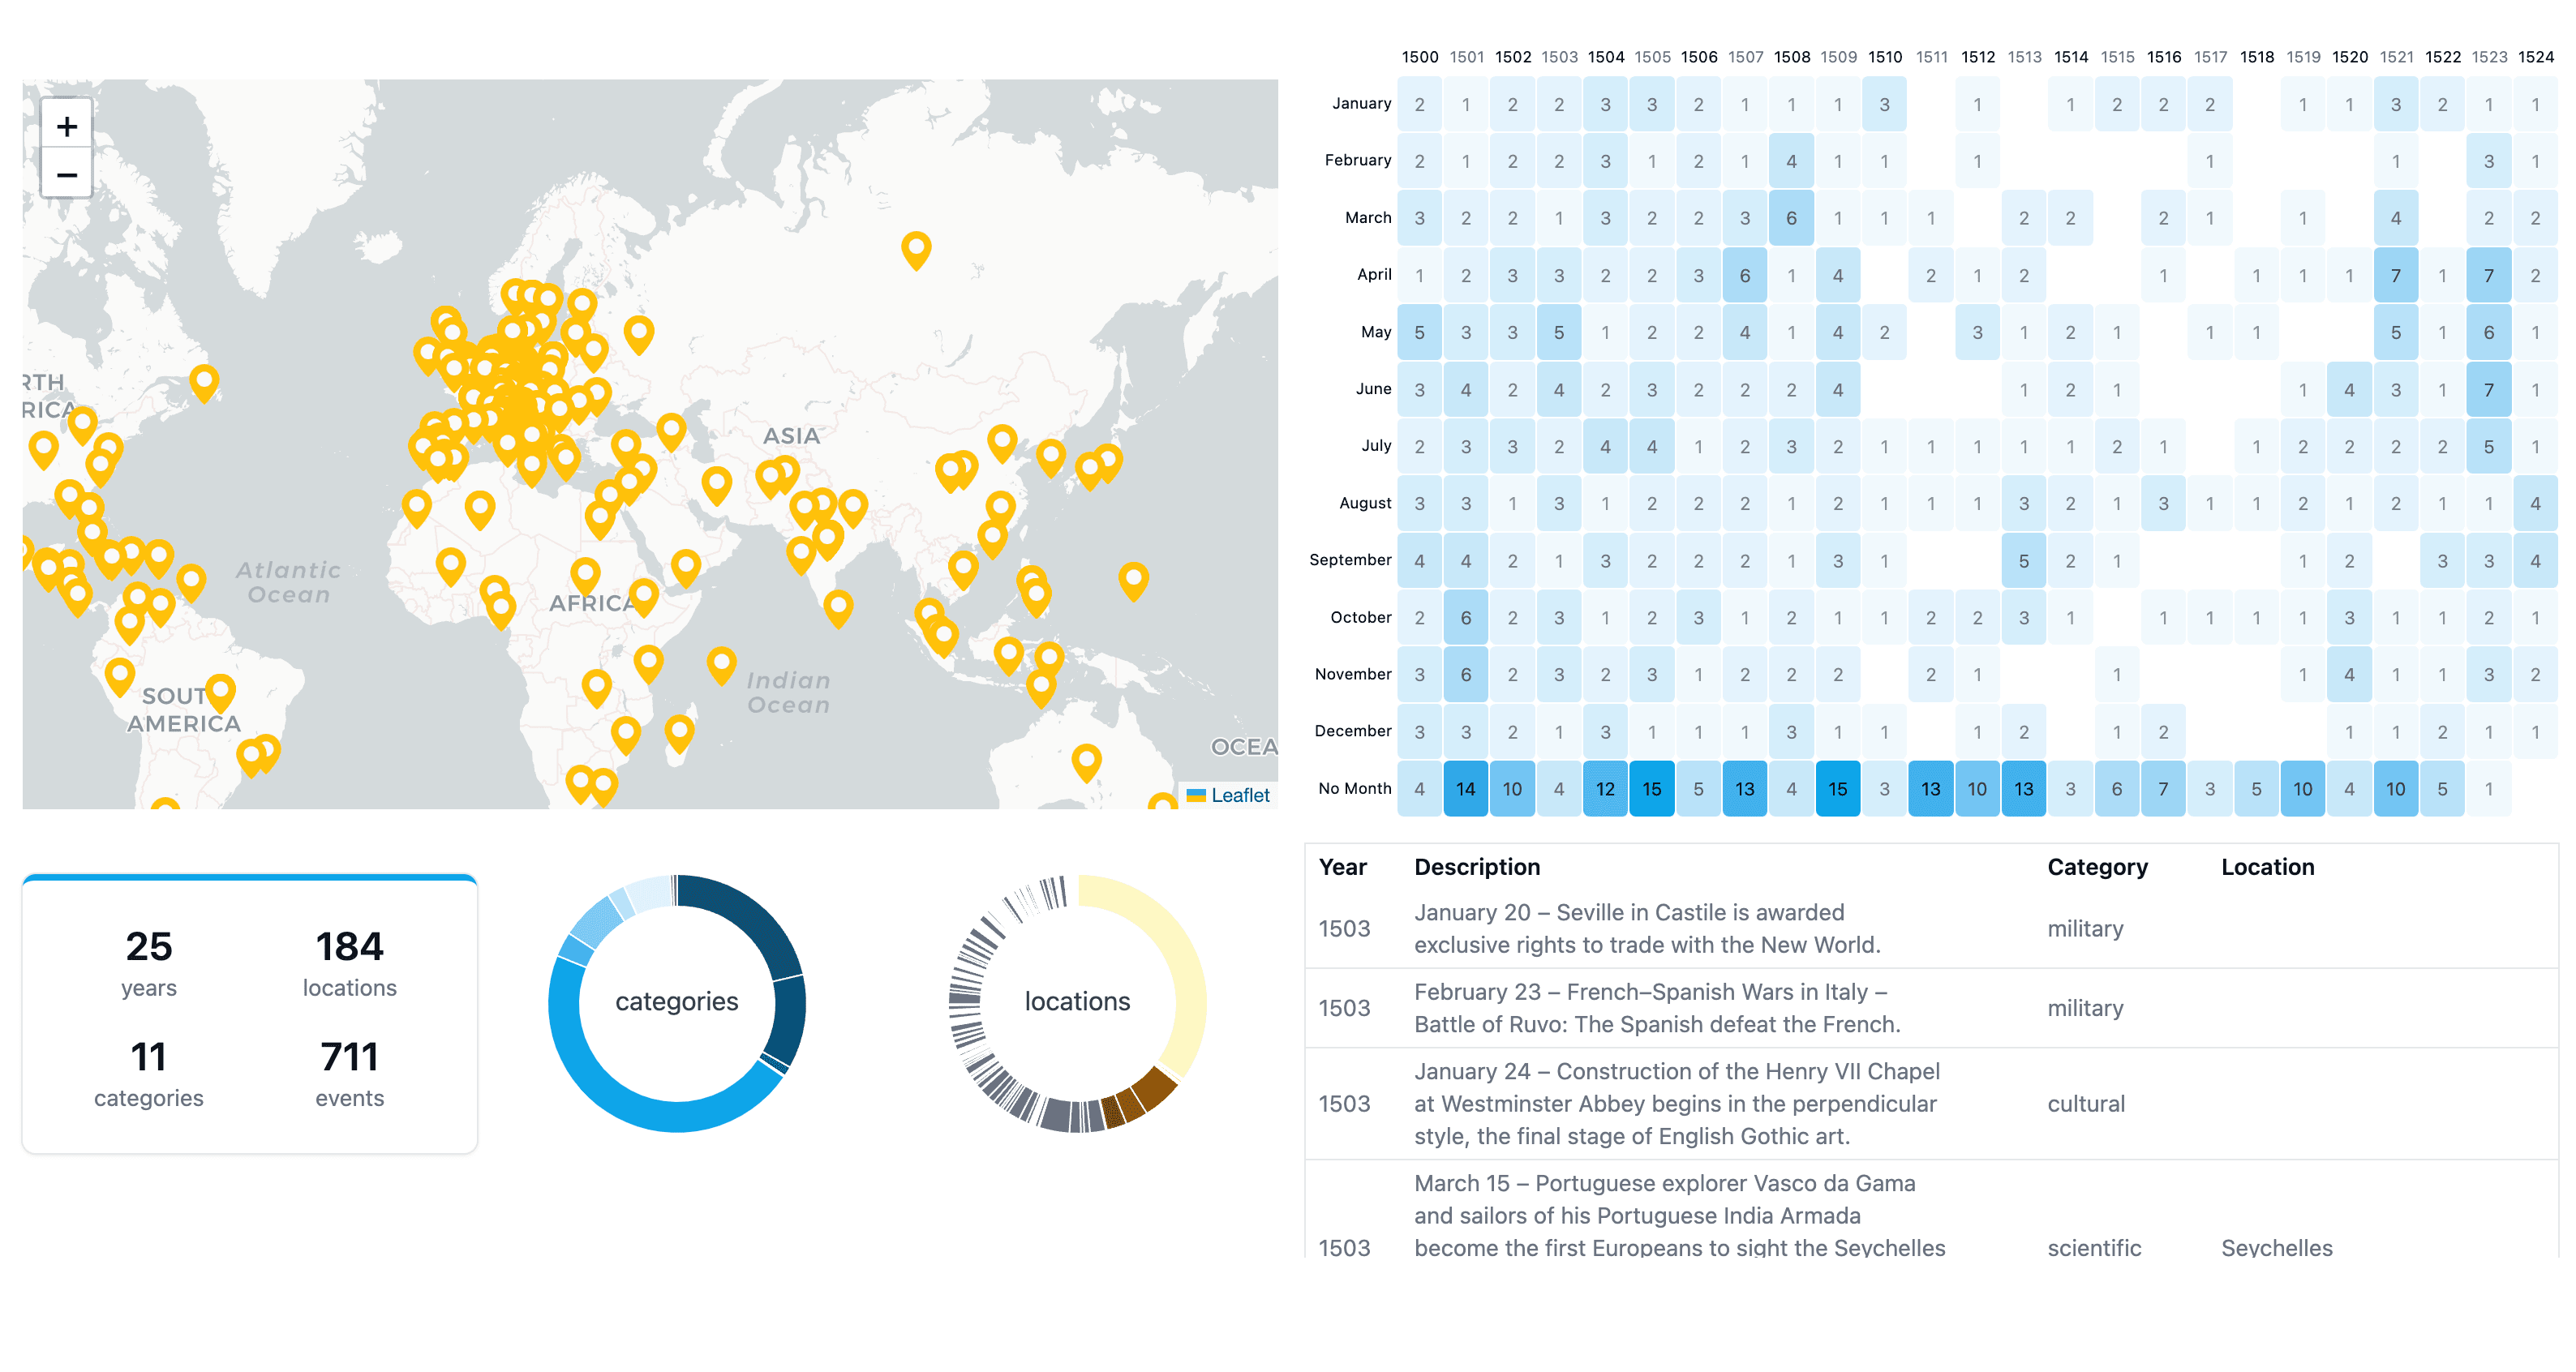
Introducing world history events dashboard
Discover the power of the world history events dashboard, an innovative tool for visualizing and analyzing historical events. This interactive platform provides new insights into our past through detailed maps, timelines, and statistical data.

Are you passionate about history or a researcher looking to dive into the significant events that shaped our world? Look no further! Introducing the world history events dashboard — a dynamic and interactive platform designed to provide a visually engaging overview of historical events across the globe.
Discover the world history events dashboard
The world history events dashboard is a tool that integrates various visualization techniques to represent historical data. From global event mapping to detailed timelines, this dashboard is a resource for anyone interested in world history.
Key features of the world history events dashboard
-
Interactive world map:
- The dashboard features a comprehensive world map dotted with event locations. You can hover over each marker to discover more about the event that occurred in that specific location. This geographical representation allows you to see the global distribution of historical events at a glance.
-
Detailed heatmap:
- A heatmap is included to highlight the frequency and distribution of events over time. Click on any cell to filter data in all charts. This visual tool helps you quickly identify periods with significant historical activity, making it easier to focus on specific eras of interest.
-
Summary statistics:
- Key statistics are displayed prominently, including the number of years covered, total locations, categories of events, and the total number of events. These statistics provide a quick snapshot of the scope of the data available in the dashboard.
-
Category and location insights:
- The dashboard includes pie charts that offer insights into the categories of events and their locations. These visualizations break down the data into easily understandable segments, allowing you to explore specific types of events or focus on particular regions.
-
Events table:
- A detailed table view shows events chronologically, providing descriptions, categories, and locations.
Why use the world history events dashboard?
- Educational resource: • Teachers and students can use this dashboard to explore historical events in a fun and interactive way. It’s perfect for visual learners who thrive on graphical data representations, making history lessons more engaging and memorable.
- Research tool: • Historians and researchers can dive deep into patterns, correlations, and trends within historical data.
- General interest: • History enthusiasts will find the dashboard a fascinating way to explore the past. Whether you’re curious about military history, cultural milestones, or scientific breakthroughs, the dashboard offers a comprehensive and captivating view of historical events.
Conclusion
The world history events dashboard isn’t just a collection of historical data; it’s a portal to our past, providing insights and understanding through innovative visualization techniques. Whether you’re a teacher, researcher, or history buff, this dashboard brings history to life in a way that’s engaging and informative.
Explore the Dashboard
